
TLDR: With high contrast surface preparation of the object, JPEG quality can be reduced to under 20% without any noticeable influence on the 3D mesh. Furthermore, the experiment indicates that the size of an image after JPEG compression seems to be a great indicator of existing features (SIFT or similar).
Method
We are currently running experiments to determine the influence of various parameters on the photogrammetry pipeline and resulting 3D mesh files.
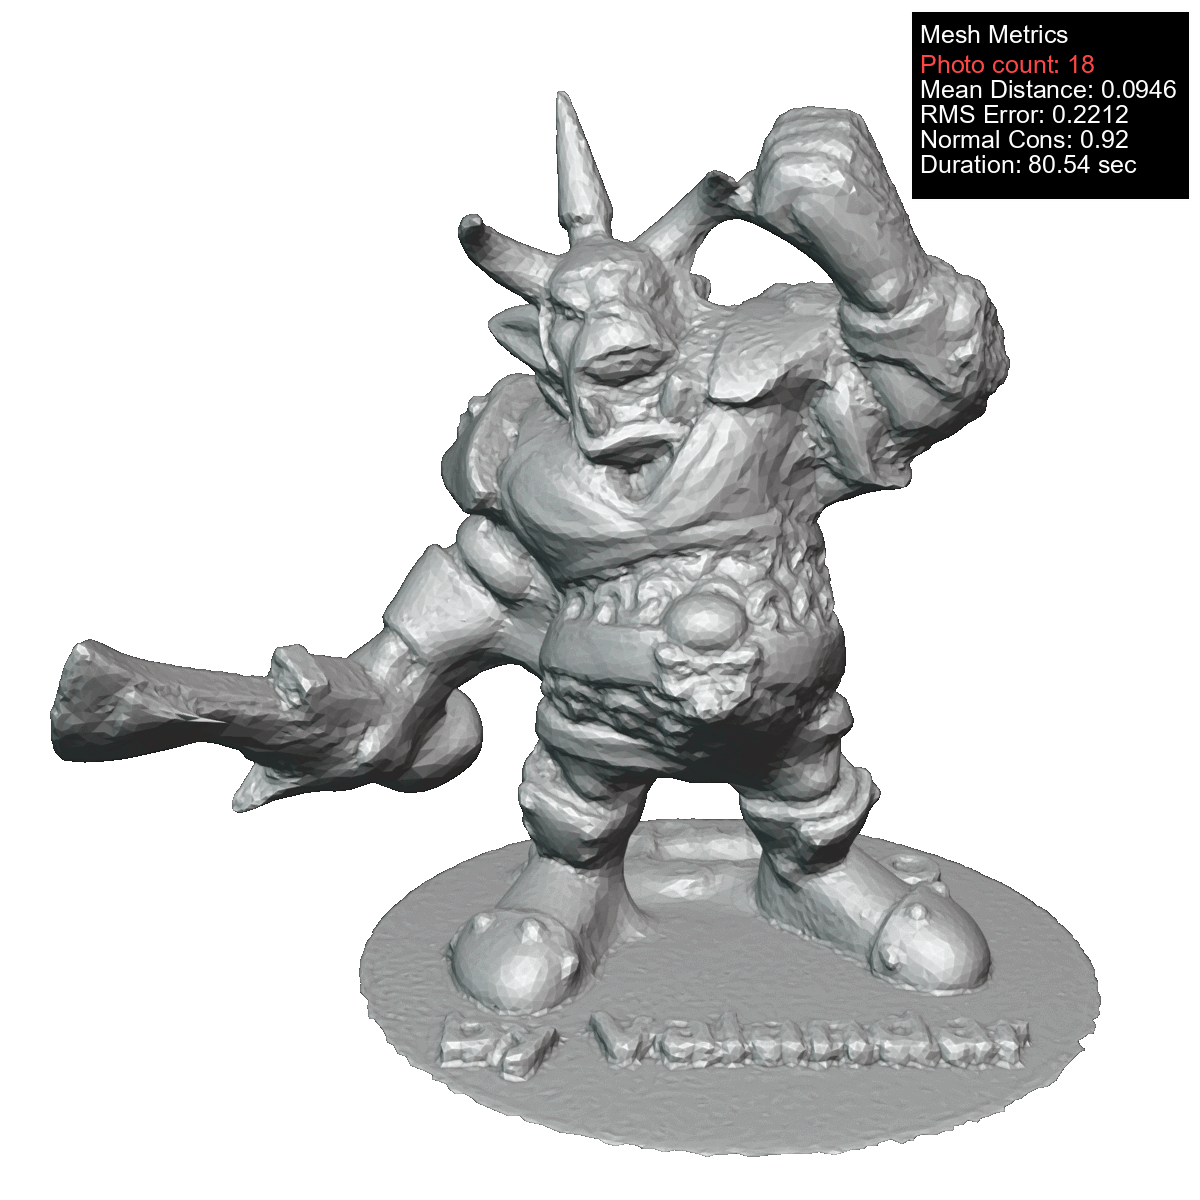
In this first test, we used a sample dataset of 100 images (which were the result of using HDR with 5 levels and stacking with 5 levels, so a total of 2500 photos). This image set gives great mesh quality on default settings.
We used the OpenScanCloud to upload and process the sets automatically. Using 10 sets per jpg quality value (as it only allows integer values) gives a better understanding of the noise level.
After obtaining the results, we faced the challenge of alignment, as photogrammetry without markers will orient the object somewhat randomly. Therefore, we used the following approach:
- brute-force sampling for various random rotations of the mesh and initial ICP alignment with only 50 iterations --> derived promising rotations
- fine-alignment with ICP using 500 iterations
This way, we created almost 1000 fine-aligned meshes for further analysis.

Analysis
We compared the 3d mesh from the lower quality sample to the 100% quality mesh as reference and got the following results. We grouped the 10 results per quality level for better results and removed some outliers, which happened due to some failures in the pipeline.
As my time is limited, I just drop the various graphs here, but if someone is interested in having a detailed look at the data, feel free to reach out to info@openscan.eu
RMS - Error
The RMS (Root Mean Square) error measures the average deviation between each point in the lower-quality JPEG-compressed pointclouds and the corresponding surfaces of the 100% quality reference mesh. The values stabilize above ~ 15% quality.

Standard deviation
The standard deviation indicates the variation or spread in the measurement errors between points in the lower-quality JPEG-compressed pointclouds and the corresponding surfaces of the 100% quality reference mesh. Again the values stabilize above ~ 15-20% quality.

Maximum distance
The maximum distance represents the largest measured deviation between any point in the lower-quality JPEG-compressed pointcloud and the corresponding surface. This metric is very sensitive to variations in the mesh and shows a higher fluctuation and uncertainty.

Processing times
This metric has some major outliers due to some failures with the OpenScanCloud processing pipeline. Ignoring those outliers gives very consistent values which only decrease below quality level of 20%.

Limitation
We only used one reference set with very distinct and high-contrast surface features. This is the best-case scenario for photogrammetry, but can not always be achieved. Results will definitely differ when using another image set. I assume, that the stabilization points will be higher when the contrast of the surface-features is lower (e.g. white spray on grey material).
Conclusion and Implications
It is surprising to see how well high-contrast features are preserved under JPEG compression even though the overall filesize is decreased significantly (300MB at 100% --> 50MB at 70% and 24MB at 20% Quality). The processing times indicate that mostly irrelevant areas of the images are compressed.
Thus suggests that for photogrammetry with high-contrast surface preparation, you can safely drop JPEG quality to about 70% without hurting mesh quality. This is a meaningful optimization - file sizes shrink by over 80% while maintaining virtually identical results.
What's more, the size of an image after JPEG compression seems to be a great indicator of feature preservation. This makes sense given how JPEG works - it keeps high-contrast edges while compressing uniform areas, which is exactly what photogrammetry algorithms like SIFT need for reconstruction.
These results have practical implications for photogrammetry workflows, especially when storage or bandwidth is limited.
Furthermore, we will use these findings to create a compute-cheap feature-density-preview algorithm which is roughly 20 times faster than SIFT in a coming blog post.

Red overlay indicates high feature density.
- Sprayed Benchy - Camera Focus on legs (further away)
- Sprayed Benchy - Camera Focus on Body
- untreated Benchy --> no features
Leave a comment
This site is protected by hCaptcha and the hCaptcha Privacy Policy and Terms of Service apply.